Photovoltaic (PV) cells convert the sun’s radiant light into electricity, and given the demand for clean energy sources today and the fact that the sun is essentially a free energy source, the development of efficient solar cells has become critical in how we embrace renewable energy and solar energy conversion.
The solar I-V curve is a critical tool and therefore an essential element in how solar and PV cells are being developed, as it allows us to understand the solar energy conversion ability and efficiency of a solar cell device.
Understanding the basics of the solar I-V curve
In basic terms, the solar I-V curve is a graphical representation of how a particular solar cell operates. It summarises the relationship between current and voltage at the existing conditions of irradiance and temperature, ie. the environment in which a solar cell is situated. The I-V curve therefore provides the information required for engineers to configure the solar cell so that it operates to its optimum potential. The optimum peak power point is known as the MPP.
So knowing the electrical I-V characteristics of a solar cell or panel is essential in determining what output a device is capable of and what its solar efficiency is.
How does the solar I-V curve work?
Solar cells produce direct current electricity (DC) and the relationship between current and voltage produces power. So solar I-V curves are created to represent the current versus the voltage for a photovoltaic device. But how do we do that?
The intensity of solar radiation is known as insolation, and the intensity with which this hits the cell controls the current (I) while the increase in temperature that is also experienced by the solar cell reduces its voltage.
PV cells, modules or arrays are typically made from semi-conductor silicon. This semi-conductor silicon has been processed into an extremely pure crystalline material which is able to absorb the photons radiated by sunlight. These photons hit the silicon atoms on the solar panel and this releases electrons which in turn causes an electrical current to flow when the PV cell or solar panel is connected to an external load, such as a battery.
This graph above shows a typical solar I-V curve graph where the PV cell is operating under normal conditions. We know that power (ie. what is delivered by a single solar cell) is the product of its output current multiplied by the voltage, so I x V. If this is done point for point for all voltages, then the power curve seen here will be obtained for the given radiation level.
Where is the solar I-V curve used?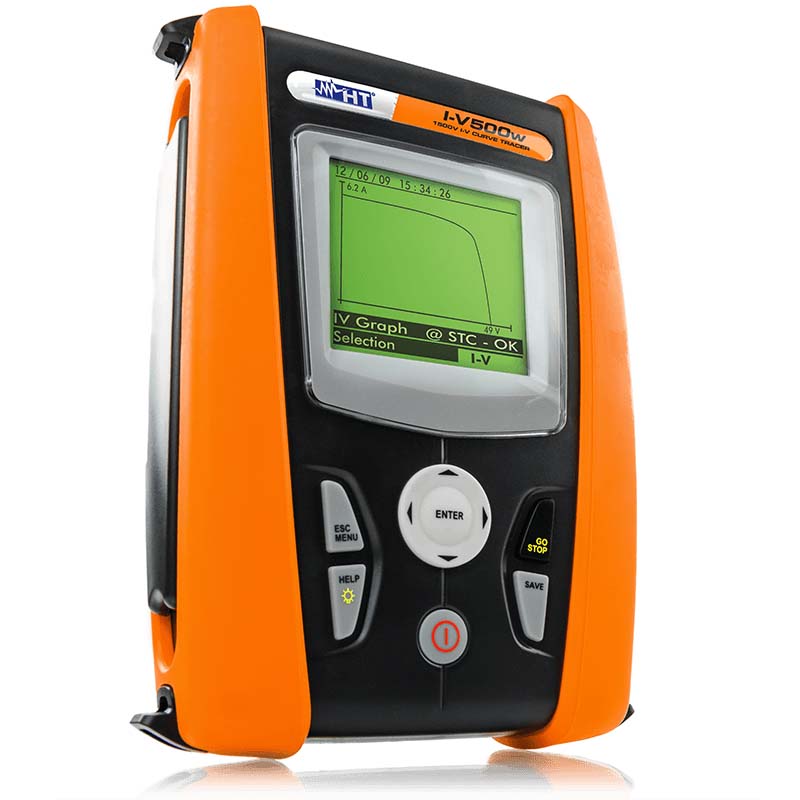
The relationship between voltage and current that is depicted on an I-V curve enables critical configuration to take place to ensure the solar cell is positioned correctly and therefore will ultimately produce enough electrical power.
So the solar I-V curve can be conducted at any time during the installation, commissioning, performance or troubleshooting of a PV cell, module or array. We are seeing more and more PV cell installations in commercial, industrial and residential settings and therefore the solar I-V curve is important in determining the optimum conditions for a particular cell, and whether that particular location is feasible or practical in terms of generating sufficient electricity.
Test Instrument Solutions have a diverse range of solar pv testing equipment - including the TIS I-V500W solar I-V curve tester.
Please note that this section is for information purposes only. Anyone using equipment referred to in this section must be suitably qualified and/or experienced within the respective field. If in doubt before use, please consult a qualified electrician or engineer & thoroughly read all instruction booklets.